Pressure mapping visually shows how force is distributed across a surface by highlighting high- and low-pressure areas using colors or numerical data. It reveals contact points, pressure concentration zones, and load distribution patterns, helping you understand how force interacts with surfaces. However, it doesn’t show the exact force magnitude in real-time or the underlying causes of pressure differences. To learn more about how this technology can benefit you, keep exploring the details below.
Key Takeaways
- Pressure mapping visualizes force distribution across surfaces, highlighting high and low-pressure zones in real-time.
- It shows contact areas, pressure intensity, and load spread but does not directly measure tissue health or injury risk.
- The system captures surface pressure patterns but cannot detect underlying tissue conditions or internal structures.
- Accurate data depends on sensor placement, calibration, and environmental factors; it does not account for dynamic changes without updates.
- Pressure maps provide valuable insights into force distribution but do not replace clinical diagnoses or comprehensive ergonomic assessments.
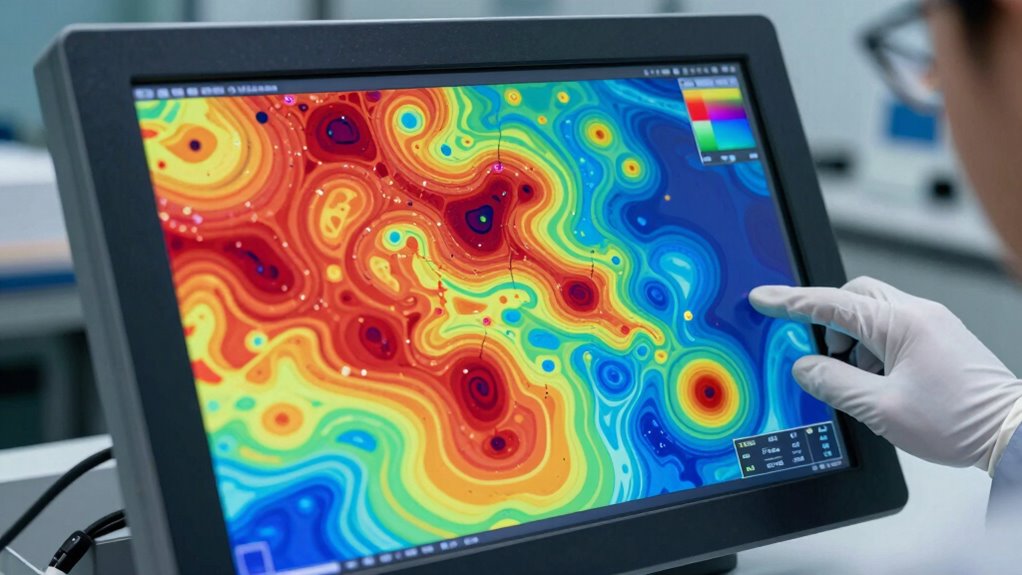
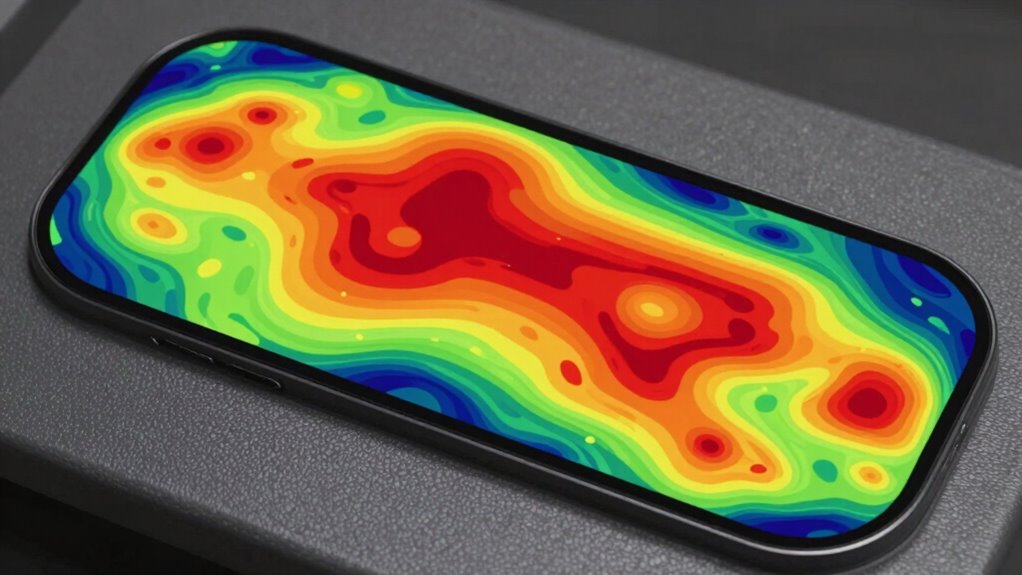
pressure mapping system for medical assessment
As an affiliate, we earn on qualifying purchases.
As an affiliate, we earn on qualifying purchases.
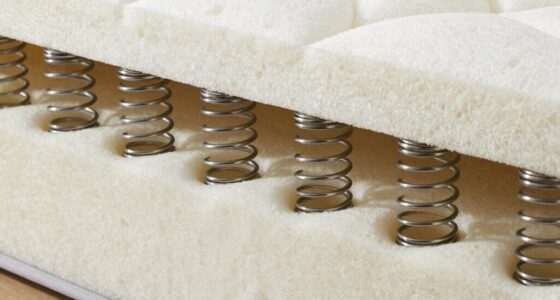
Understanding How Pressure Mapping Works
Pressure mapping works by using sensors that detect and record the distribution of pressure across a surface. These pressure sensors are placed strategically to capture variations in force, providing real-time data. Once the sensors gather initial pressure points, data interpolation comes into play. This process estimates pressures in areas between sensors, creating a detailed, continuous pressure map. Data interpolation guarantees you get an all-encompassing view, even with limited sensor points, making the map more accurate and useful. The sensors convert physical pressure into electrical signals, which are then processed to generate visual representations. This combination of sensors and data interpolation allows you to understand pressure distribution precisely, revealing subtle pressure differences and helping inform better decisions for comfort, safety, or performance. Sensor technology enhances the accuracy and effectiveness of pressure mapping systems. Additionally, advancements in sensor integration contribute to more seamless and precise pressure data collection. A thorough understanding of pressure distribution helps optimize various applications, from ergonomic design to medical assessments.
pressure mapping sensor mat
As an affiliate, we earn on qualifying purchases.
As an affiliate, we earn on qualifying purchases.
Types of Data in Pressure Maps
When analyzing pressure maps, you’ll notice different types of data reveal key insights. You can observe pressure distribution patterns that show how force spreads across a surface, visualize force magnitudes to identify hotspots, and examine contact area details to understand contact points more clearly. These data types help you interpret how pressure interacts with surfaces and informs your decisions. Additionally, understanding how to preserve and analyze evidence is crucial in various contexts, such as criminal investigations, where evidence preservation ensures case integrity. Recognizing pressure mapping techniques can further enhance your ability to analyze complex data sets effectively. Moreover, familiarizing yourself with pressure data interpretation techniques allows for more accurate assessments of the pressure interactions involved. Developing a solid understanding of pressure measurement accuracy can also improve the reliability of your analysis and support better decision-making. Being aware of pressure data variability is essential for accounting for inconsistencies that may affect your interpretation and conclusions.
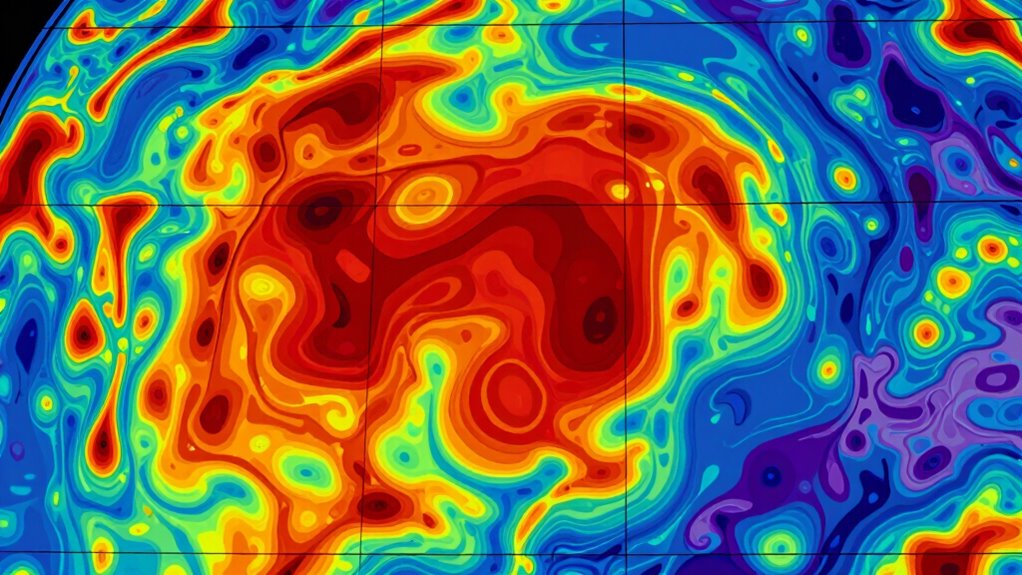
Pressure Distribution Patterns
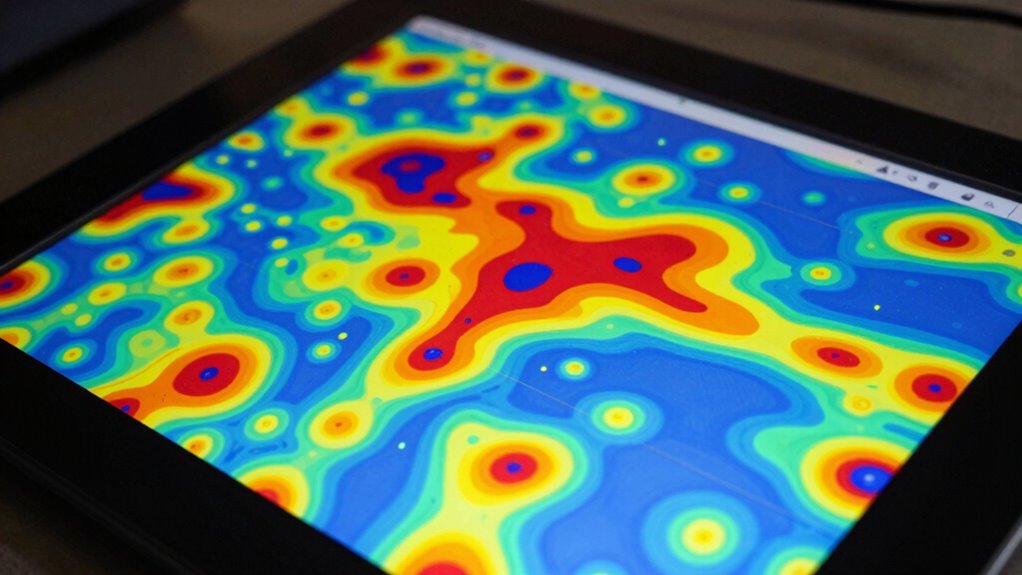
Understanding pressure distribution patterns requires examining the different types of data represented on pressure maps. These patterns reveal how pressure is spread across a surface, illustrating load distribution. You’ll notice areas with high-pressure concentration, shown as warmer colors or denser zones, indicating where most force is applied. Conversely, cooler colors or sparser regions show lower pressure. Recognizing these pressure patterns helps identify uneven load distribution, which can lead to discomfort or tissue damage. For example, in seating assessments, a well-balanced load distribution ensures comfort and reduces pressure points. By analyzing these patterns, you gain insight into how pressure interacts with the surface, allowing for better design or intervention to optimize support and minimize risks. Additionally, understanding the importance of proper pressure mapping techniques enhances the accuracy of these assessments and supports effective decision-making. Proper pressure distribution analysis is crucial for accurate evaluations and successful interventions.
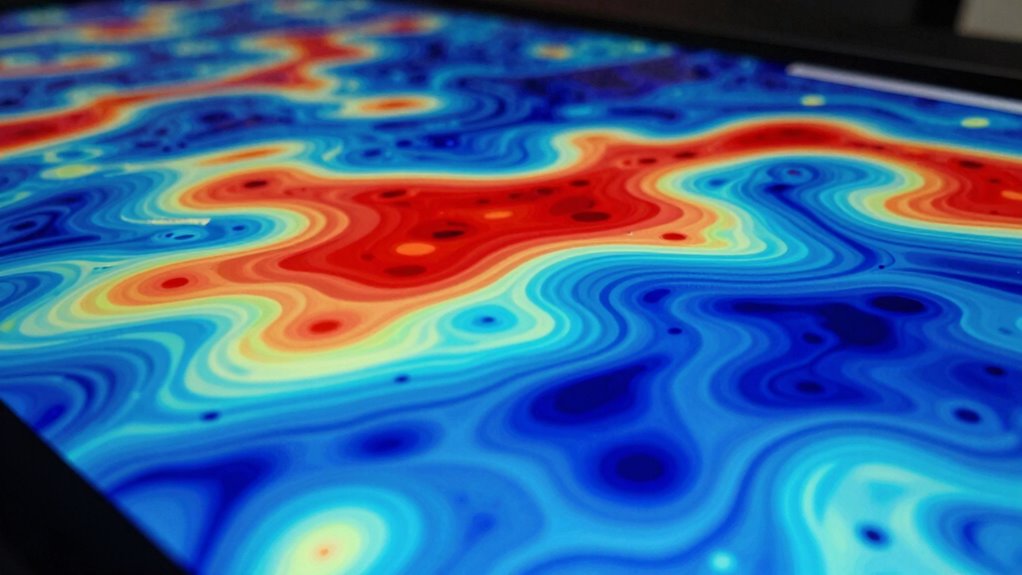
Force Magnitude Visualization
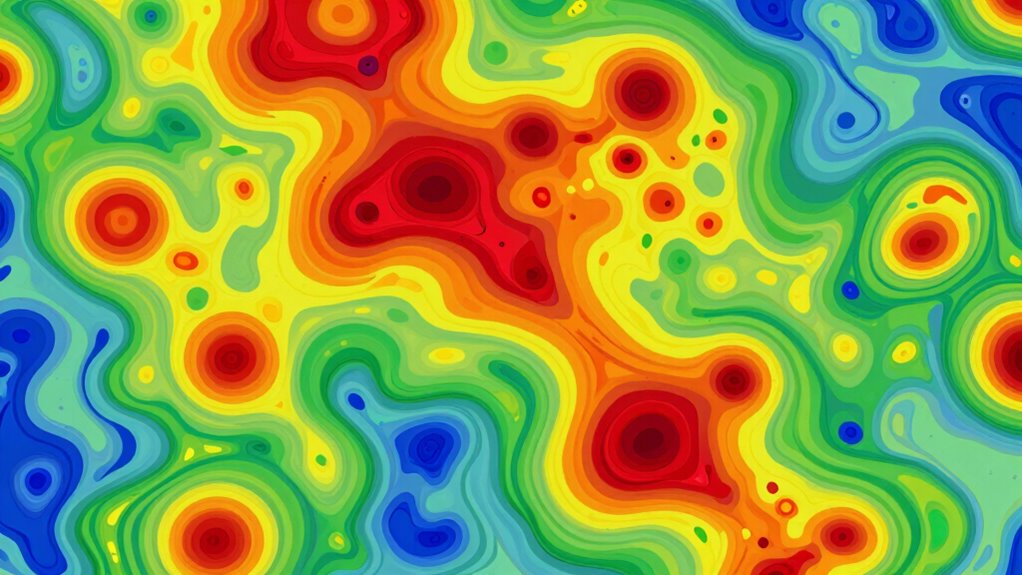
Have you ever wondered how pressure maps quantify the amount of force exerted on a surface? Force magnitude visualization is vital to understanding this. It displays the intensity of force at each point, often using color gradients or numerical values, to show how much force is applied. This type of data helps you interpret the magnitude of pressure, revealing areas with high or low force concentrations. By analyzing force visualization, you can identify zones of excessive pressure or underloaded regions, essential for applications like seating comfort or injury prevention. Remember, the focus here is on the force’s strength, not just its presence or distribution. Accurate magnitude interpretation allows you to make informed decisions based on the actual force exerted, providing a clear picture of the force distribution across the surface. Additionally, understanding the net worth of individuals involved in related fields can offer insights into the financial aspects behind the technology or research. Recognizing the measurement accuracy of pressure data is also crucial for reliable analysis and application. Moreover, considering the data resolution helps ensure the detailed quality of pressure maps for precise assessments.
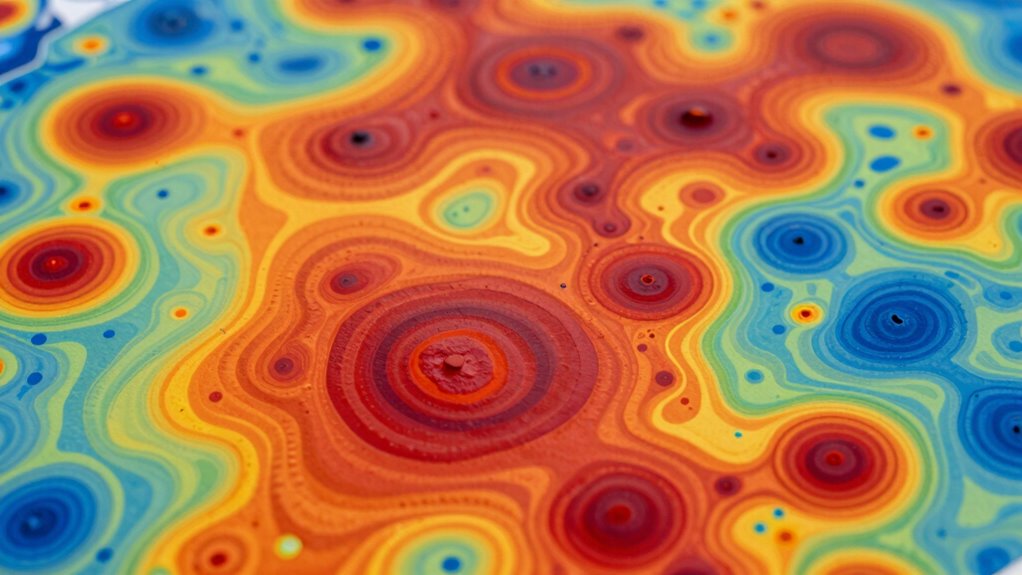
Contact Area Details
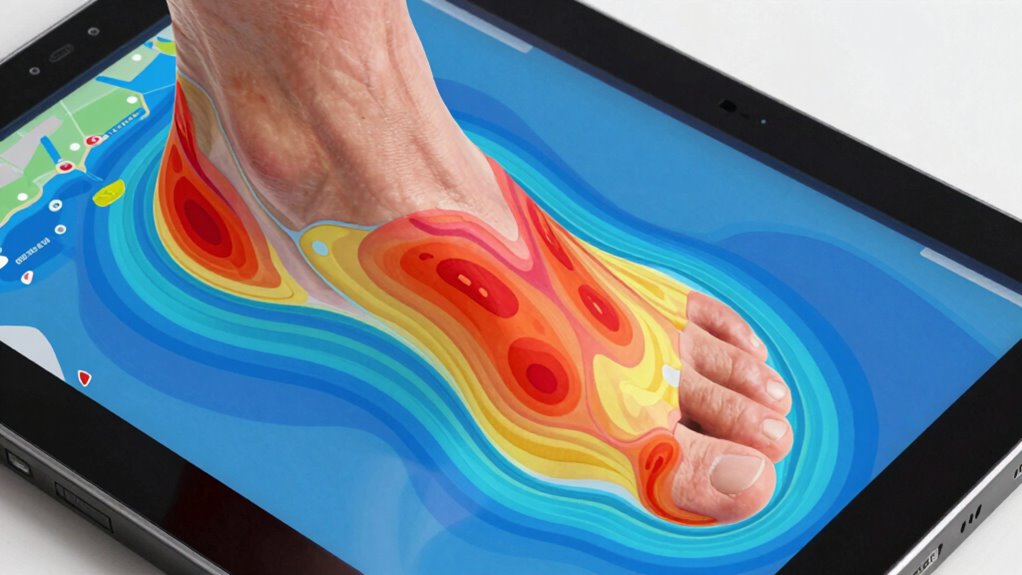
Contact area details in pressure maps provide critical information about the regions where surfaces come into contact. This data reveals the size and shape of the contact zone, helping you understand how pressure distributes across the interface. Pressure zones indicate areas experiencing higher or lower pressure, highlighting where contact is most significant. By analyzing contact areas, you can identify pressure concentrations that may lead to discomfort or tissue damage, especially in medical or ergonomic settings. The map’s visual cues show whether contact is evenly spread or focused in specific regions. Recognizing these pressure zones allows you to make informed adjustments, optimize load distribution, and improve overall comfort and safety in applications like seating, footwear, or medical devices. Additionally, understanding the contact area can assist in selecting appropriate fabrics like Suprem, which offer durability and comfort in pressure-sensitive applications. Considering the pressure distribution helps ensure that materials are suitable for the specific load patterns, enhancing both performance and comfort. Being aware of pressure mapping techniques can further refine how you interpret these contact details for better ergonomic outcomes.
pressure distribution analysis device
As an affiliate, we earn on qualifying purchases.
As an affiliate, we earn on qualifying purchases.
Pressure Mapping Technologies Across Industries
Pressure mapping technologies are revolutionizing how various industries monitor and analyze force distribution. In ergonomic design, these tools help identify pressure points to optimize product comfort and reduce strain, leading to safer, more user-friendly furniture and equipment. During material testing, pressure maps reveal how materials respond under different loads, ensuring durability and performance standards are met. Healthcare providers use pressure mapping to prevent pressure ulcers and improve seating solutions. In automotive industries, these sensors aid in seat design and crash testing. Sports science applies pressure mapping to enhance athlete equipment. Across these sectors, pressure mapping offers detailed insights into force dynamics, enabling better design, safety, and performance without relying solely on traditional testing methods. Fact-checking & media literacy play a vital role in interpreting pressure data accurately and avoiding misconceptions. Additionally, understanding pressure distribution patterns helps industries develop more effective solutions tailored to specific applications. By combining pressure mapping with reliable data interpretation, industries can make more informed decisions that enhance safety and effectiveness. Moreover, advancements in sensor accuracy continue to expand the potential applications and precision of pressure mapping systems. A greater understanding of force distribution enables industries to innovate and improve product performance further.
pressure mapping for ergonomic design
As an affiliate, we earn on qualifying purchases.
As an affiliate, we earn on qualifying purchases.
Using Pressure Maps to Improve Comfort and Safety
Pressure maps play an essential role in enhancing both comfort and safety by providing detailed visualizations of force distribution across surfaces. By analyzing these maps, you can optimize ergonomic design, reducing pressure points and preventing discomfort or injury. Proper sensor calibration guarantees accurate data, which is critical for making informed adjustments. Using pressure maps, you can identify areas of excessive pressure that may cause skin breakdown or pain, allowing you to modify the design or positioning accordingly. This process improves user experience and safety, especially in healthcare, seating, and workplace settings. Home charging, understanding how to interpret pressure maps can help improve the design of ergonomic seating and reduce fatigue during long periods of sitting. Additionally, staying aware of market trends and insights can inform decisions about incorporating advanced technology into ergonomic solutions. Being familiar with pressure distribution analysis techniques can further enhance the effectiveness of these assessments. For instance, integrating smart sensors can enable real-time feedback and more precise adjustments to optimize comfort, which is increasingly relevant as sensor technology continues to evolve.
Limitations and Common Mistakes in Pressure Mapping
Despite its usefulness, pressure mapping has notable limitations and common pitfalls that can affect accuracy and reliability. One major issue is sensor calibration; if sensors aren’t properly calibrated, the data can be misleading, leading to incorrect conclusions about pressure distribution. Additionally, data resolution plays a vital role—low-resolution maps might miss subtle pressure differences, while overly high resolution can produce noise and obscure meaningful patterns. Another mistake is neglecting to regularly check and maintain the sensors, which can cause drift and inaccuracies over time. You should also be cautious about environmental factors like temperature and surface variability, which can distort readings. Recognizing these limitations helps guarantee you interpret pressure maps more accurately and avoid mistakes that could compromise safety and comfort assessments.
Factors to Consider When Interpreting Pressure Data
When interpreting pressure data, you need to take into account factors that influence accuracy, like sensor placement and calibration. Keep in mind that pressure mapping has limitations, such as resolution issues and potential artifacts. Being aware of these points helps ensure you draw reliable conclusions from your data.
Factors Affecting Data Accuracy
Accurately interpreting pressure mapping data requires careful consideration of several factors that can influence its reliability. Sensor calibration is vital; if sensors aren’t properly calibrated, your readings can be off, leading to inaccurate conclusions. Environmental influences, such as temperature and humidity, also impact data accuracy by affecting sensor performance. Additionally, placement and contact quality between the sensor and surface can introduce errors. System stability and signal noise may distort readings if not managed properly. Finally, sensor drift over time can cause gradual inaccuracies if regular maintenance isn’t performed. Being aware of these factors helps you distinguish genuine pressure patterns from artifacts, guaranteeing more dependable insights from your pressure mapping data.
- Proper sensor calibration ensures accurate readings
- Environmental influences can alter sensor responses
- Contact quality affects data validity
- System stability and noise can distort signals
- Regular maintenance prevents sensor drift
Limitations of Pressure Mapping
Have you considered that pressure mapping data has inherent limitations that can affect your interpretations? One key factor is sensor calibration; if sensors aren’t properly calibrated, the data may be inaccurate, leading you to false conclusions about pressure points. Additionally, data resolution plays a vital role—low resolution might miss subtle pressure variations, while higher resolution provides more detailed insights. However, even with high-resolution sensors, calibration drift over time can compromise data quality unless regularly maintained. These limitations mean you should interpret pressure maps carefully, understanding that they’re not perfect representations. Always verify sensor calibration before use and consider the resolution’s adequacy for your specific application to ensure your assessments are as accurate as possible.
Key Takeaways for Using Pressure Maps Effectively
To use pressure maps effectively, focus on understanding what the data reveals about contact points and pressure distribution. This insight helps optimize ergonomic design and select appropriate material properties for comfort and support. Recognize that pressure maps are tools to identify high-pressure areas that may cause discomfort or tissue damage. Use this data to refine cushion shapes, seating arrangements, or footwear. Remember, pressure distribution isn’t static; it varies with posture and activity. Consider the context and user feedback alongside the map results. Proper interpretation ensures you make informed decisions about product design or adjustments. Ultimately, harness pressure maps to enhance user comfort and safety, but always combine findings with practical experience. This approach maximizes their effectiveness and application.
Frequently Asked Questions
How Accurate Are Pressure Maps in Predicting Long-Term Comfort?
Pressure maps can give you a good idea of short-term comfort, but their predictive accuracy for long-term comfort isn’t perfect. You might find the map shows ideal pressure distribution now, but over time, factors like body changes and material wear can alter comfort levels. So, while pressure mapping is useful for initial assessments, don’t rely solely on it to predict long-term comfort. Consider other factors for an all-encompassing view.
Can Pressure Mapping Detect Underlying Health Issues?
Imagine a snapshot revealing where your body presses against a surface—that’s pressure mapping. While it’s useful in ergonomic assessments and some medical diagnostics, it can’t detect underlying health issues. Think of it as a tool that highlights pressure points but doesn’t diagnose health conditions. You’d need more detailed medical diagnostics for that. Pressure maps give valuable insights but shouldn’t replace medical evaluations for underlying health concerns.
What Are the Costs Associated With Implementing Pressure Mapping Technology?
The costs of implementing pressure mapping technology mainly involve equipment expenses and ongoing maintenance. You should consider cost considerations like purchasing high-quality sensors and software, which can range from a few thousand to tens of thousands of dollars. Additionally, factor in training staff and maintenance costs. While initial investment can be significant, the technology offers valuable insights that can improve patient outcomes and optimize treatment plans.
How Do Environmental Factors Affect Pressure Map Readings?
Environmental factors like temperature, humidity, and surface conditions can influence pressure map readings. You need to account for environmental variability by regularly calibrating your sensors to guarantee accuracy. Fluctuations in the environment can cause sensor drift or inconsistent data, so maintaining a controlled environment or adjusting calibration settings helps you get reliable results. By staying aware of these factors, you’ll improve the precision of your pressure mapping data.
Are There Industry Standards for Pressure Map Data Interpretation?
Yes, industry standards guide pressure map data interpretation, ensuring consistency and accuracy across applications. You should familiarize yourself with these standards, such as those from ISO or other relevant organizations, to accurately analyze pressure distribution and pressure points. These standards help you understand what the data signifies, avoid misinterpretation, and make informed decisions based on pressure mapping results. Following industry standards is essential for reliable, comparable, and meaningful insights.
Conclusion
By understanding what pressure mapping reveals—and what it doesn’t—you can make smarter decisions. For example, if you’re designing a wheelchair cushion, pressure maps help you identify high-pressure points to prevent discomfort. But remember, they don’t show tissue health or long-term effects. Use this tool alongside other assessments to improve safety and comfort effectively. With the right approach, pressure mapping becomes a powerful guide in optimizing designs and outcomes.