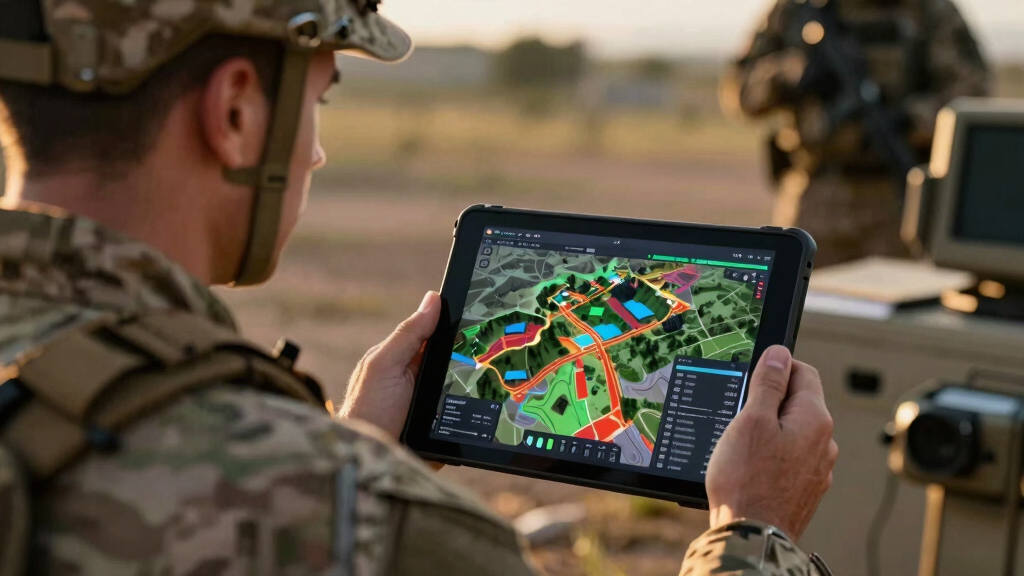

📊 Full opportunity report: The Power Of AI In Dynamic Battlefield Visualizations on ThorstenMeyerAI.com — validation score, market gap, and execution plan.
TL;DR
An innovative web-based project uses AI and browser technology to visualize Bitcoin trading as a dynamic battlefield. It connects live market streams to create an immersive, cinematic experience without backend infrastructure. This demonstrates the potential of AI in creative data visualization, though it is not a trading tool.
isbitcoindead.com has launched Bitcoin War, an AI-powered, real-time visualization that depicts Bitcoin trading activity as an ongoing cinematic battlefield. The project connects directly to live market streams from Binance and Coinbase, translating every trade into visual combat, with no backend infrastructure involved. This innovative use of browser technology highlights the emerging role of AI and web graphics in data storytelling and artistic expression, making complex market data accessible and engaging for viewers worldwide.
The Bitcoin War visualization is built entirely on client-side web technologies, utilizing Canvas 2D graphics, WebAudio synthesis, and real-time WebSocket streams. It features a minimal footprint of approximately 180KB, enabling instant access through any modern browser. The system visualizes buy and sell orders as opposing forces on a battlefield, with large liquidations represented as airstrikes, creating a visceral depiction of market volatility. An automatic camera shifts perspectives to highlight key moments, while a live DEFCON meter indicates market tension. A scrolling war log narrates ongoing trades, and a synthetic soundtrack amplifies the experience. Importantly, the project explicitly states it is not a trading tool, wallet, or signal provider, but a purely artistic visualization of market activity, with the footer clarifying, “a live reading of the BTC/USDT tape · no advice, only war.”
Developed by an independent team, the project aims to demonstrate how advanced web and AI technologies can be used creatively to interpret complex data streams. The visualization is freely accessible at war.isbitcoindead.com, providing an immersive experience for both tech enthusiasts and casual viewers interested in market dynamics.
Implications of AI-Driven Market Visualizations
This project illustrates how artificial intelligence and web technologies can be harnessed to produce immersive, real-time visualizations of financial markets. It offers a new way to interpret market activity beyond traditional charts, emphasizing the raw chaos and strategic tension inherent in trading. While not a trading tool, such visualizations could influence how traders, analysts, and the public perceive market volatility and activity, fostering a deeper understanding of market dynamics through engaging, cinematic representations.
Furthermore, this demonstrates the potential for browser-based AI applications to deliver complex data experiences without heavy backend infrastructure, making advanced visualization accessible to a broad audience. It also raises questions about the use of artistic and AI-driven tools in financial education, analysis, and even entertainment, expanding the boundaries of data storytelling.

Interactive Data Visualization for the Web: An Introduction to Designing with D3
As an affiliate, we earn on qualifying purchases.
As an affiliate, we earn on qualifying purchases.
Development of Web-Based Market Visualizations
Recent years have seen increasing interest in using web technologies and AI for data visualization, particularly in financial markets. Projects like this build on advances in browser graphics, real-time data streaming, and client-side AI processing. Prior efforts have focused on traditional charts and dashboards, but the Bitcoin War project pushes into immersive, cinematic territory, inspired by the potential of WebGL, WebAudio, and WebSocket technology. It follows a broader trend of blending art, technology, and data to create engaging educational and entertainment tools, although its specific focus on market chaos as a battlefield is a novel approach.
While still experimental, these innovations reflect a growing recognition of the power of browsers as platforms for complex, real-time data storytelling, without reliance on server-side processing or heavy infrastructure.
„This project showcases how advanced web tech and AI can create visceral, real-time visualizations of market activity, transforming data into an immersive experience.“
— an anonymous researcher

Marketing Holders 5 Pack Sign Holder Countertop for 8.5" x 11" Signs Display for Advertisements and Graphic Images in Offices and Stores Clear Acrylic T Shaped Double Sided Bottom Load Stand
Sign Holder 8.5"W x 11"H Double Sided Bottom Load Table Tent
As an affiliate, we earn on qualifying purchases.
As an affiliate, we earn on qualifying purchases.
Limitations and Unanswered Questions About the Visualization
It is not yet clear how accurately the visualization reflects real-time market conditions or if it can be adapted for analytical purposes. While it provides an engaging artistic depiction, its usefulness for traders or analysts remains unproven. Additionally, the long-term stability and scalability of such browser-based systems, especially under high market volatility, are still untested. The project explicitly states it is not a trading tool, but the potential for misinterpretation or misuse by viewers is an open question.
Zyntrazy Real-Time Crypto, US Stocks & Gold Display with Weather, Clock & Photos, Creative Gift for Husband, Boyfriend or Women
Next-Gen System Upgrade — Backed by CoinGecko, it monitors real-time prices for over 2000 leading cryptocurrencies and the…
As an affiliate, we earn on qualifying purchases.
As an affiliate, we earn on qualifying purchases.
Future Developments and Potential Applications of AI Visualizations
Further development could include integrating more detailed data streams, expanding to other markets, or adding interactive features for educational purposes. Researchers and developers may explore how such visualizations influence perception and decision-making, potentially leading to new tools for market analysis or financial education. As browser technologies evolve, the capability for more sophisticated, AI-driven visualizations will likely grow, broadening their application beyond artistic expression into analytical and strategic domains.

Financial Modeling and Reporting with Microsoft Power BI: Build models, KPIs, and modern finance reports in Power BI from scratch
As an affiliate, we earn on qualifying purchases.
As an affiliate, we earn on qualifying purchases.
Key Questions
Is Bitcoin War a trading tool?
No, Bitcoin War is purely a visual and artistic representation of market activity. It does not involve trading, signals, or financial advice.
How does the visualization work?
It connects to live market streams via WebSocket, visualizing trades as combatants on a battlefield using browser graphics and sound, all processed client-side without backend infrastructure.
Can I customize or interact with the visualization?
Currently, the visualization is designed as a passive experience. Future versions may include interactive features, but the current project is primarily for viewing and artistic appreciation.
Is this visualization accurate or useful for trading?
No, it is intended as an artistic depiction and not a trading or analysis tool. Its purpose is to illustrate market chaos visually, not to inform trading decisions.
Where can I see the visualization?
You can access it for free at war.isbitcoindead.com.
Source: ThorstenMeyerAI.com